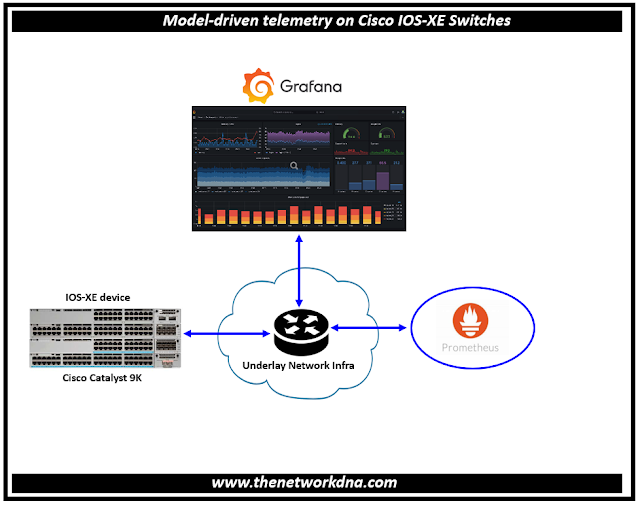
Model-driven telemetry on Cisco IOS-XE Switches
Switches like the Catalyst 9000, routers like the ASR 1000, CSR 1000v, and ISR 1000 and 4000, Catalyst 9800 Wireless LAN controllers, and a few more items from the IoT and Cable product lines are the platforms that run Cisco IOS XE. Model-driven telemetry has been supported since the introduction of IOS XE 16.6, giving network operators more choices for gathering data from their network.
 |
| Fig 1.1- Model-driven telemetry on Cisco IOS-XE Switches |
Although SNMP has historically been very effective at monitoring enterprise networks, it has several drawbacks, including unstable transport, inconsistent encoding between versions, a lack of filtering and data retrieval options, and the effect of polling a device simultaneously by multiple Network Monitoring Solutions on its CPU and memory.
In addition to providing an extra interface through which data can now be published, model-driven telemetry solves many of the shortcomings of older monitoring solutions.
Step 1: Log in to the Cisco IOS XE based Catalyst 9300 using SSH or console connection.
NOTE: This configures a sensor group named "CPU" and specifies the path to the CPU utilization data.
SW1(config)# restconf
SW1(config)# telemetry ietf sensor-group 11
SW1(config)# sensor-path Cisco-IOS-XE-process-cpu-oper:cpu-usage/cpu-utilization/five-seconds
SW1(config)# exit
SW1#
Step 2: Define Telemetry Subscription
SW1(config)# telemetry ietf subscription 11
SW1(config)# sensor-group-id CPU sample-interval 5000
SW1(config)# destination-address 10.10.1.10
SW1(config)# destination-port 9090
SW1(config)# protocol https
SW1(config)#encoding json
SW1(config)# exit
SW1#
Step 3: Install: Prometheus and Edit Prometheus Configuration: Open the prometheus.yml configuration file to add a New Job for Cisco IOS XE
Telemetry:
Prometheus YAML
scrape_configs:
- job_name: 'ios-xe-telemetry'
metrics_path: '/restconf/data'
params:
query: ['telemetry=CPU']
static_configs:
- targets: ['I10.10.1.20:443']
Step 4: Install Grafana to set up to visualize data from Prometheus, Log in to Grafana and go to the home dashboard.
The visualization engine that shows the telemetry data is called Grafana. To access the data that is kept there the same data that you obtained from iOS XE and it makes a call to Prometheus.
Step 5: Click on "Configuration" in the side menu, then select "Data Sources". Click on "Add data source" and choose "Prometheus". Configure the Prometheus data source by providing the URL of your Prometheus server and other relevant details.
Step 6: Click "Save & Test" to verify the connection to Prometheus. Click on the "+" icon in the side menu and select "Dashboard". and Click on "Add new panel".
Step 7: In the panel editor, click on "Query" to open the query editor. In the query editor, select the Prometheus data source you added.
Step 8: Write a PromQL query to fetch the data you want to visualize. As we did in our example cpu_utilization{job="ios-xe-telemetry"} to visualize CPU utilization data collected from the Cisco IOS XE Catalyst 9300. and Click on "Run" to execute the query and check results.
Step 9: Configure visualization options such as graph type, axes, legend, etc. Click Apply and save the panel.


